Are you training well? Or do you run junk miles? Let's talk about the "Fitness" indicator and how it helps you make sense of running.
Training efficiency metrics.
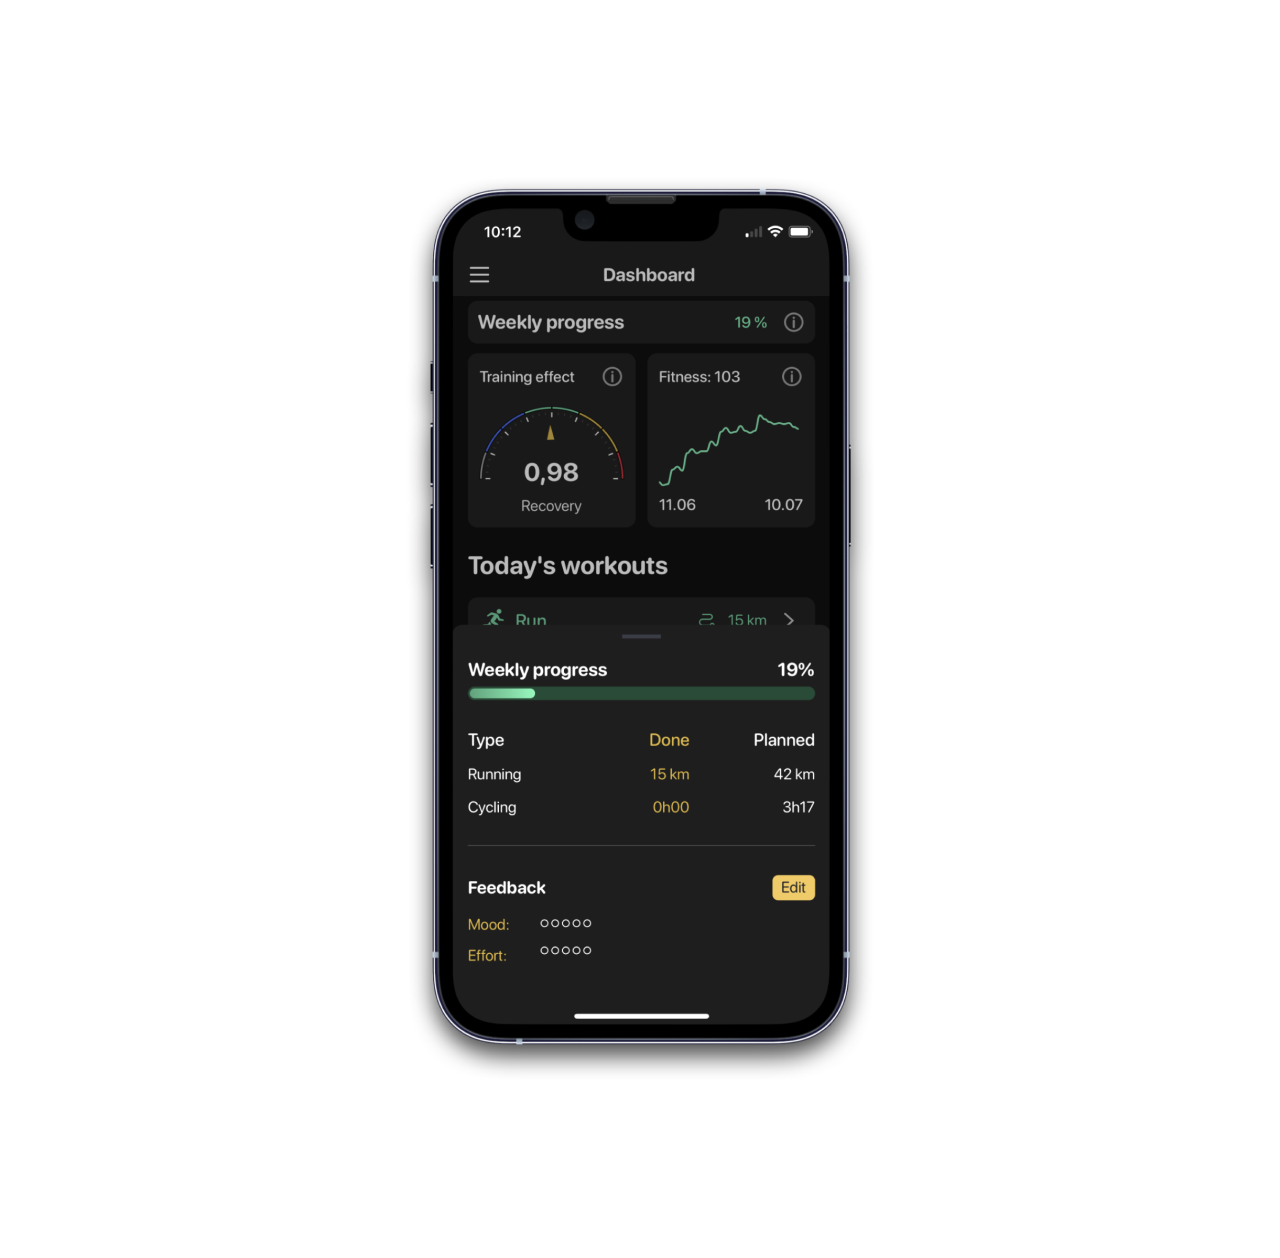
To see the effect of the training and check your progress, we calculate various training metrics, such as Training Effect and Fitness. These metrics are presented on the Dashboard once in the app.
The Training Effect shows the impact your recent workouts have had on you — recovery, optimal, above optimal, overtraining, etc. Another metric, Fitness, shows the cumulative amount of training (or workload) you have done over the long term.

Fitness Metric Details.
Fitness is the cumulative effect of exercises completed over a representative period of time. It is calculated based on intensity (pace for running, power for cycling) and volume (distance and time). The more quality workouts you have done, the higher your Fitness level. Quality workouts are intervals, uphill runs, tempo runs, and long runs. Quality workouts cannot be done without recovery or easy runs. All of them are in balance in your plan. Let´s see how that works.
Fitness Dynamics graph.
Fitness graph can go up and down at different stages of training. For example, your race performance makes the biggest positive contribution to your Fitness growth. This is usually reflected on the graph by a significant growth of the index. As they say, “the race is the best training”. 😊
After a race performance, the body needs to recover and reduce stress. Your training plan takes that into account and offers a recovery or light week (or, sometimes, even two weeks). During this period, your Fitness metric naturally decreases. This is normal and even beneficial for future fitness growth. You will be able to recharge your “batteries” and get ready for a new training, after which your fitness will start to grow again.
When approaching important race dates, your plan reduces the training load. This is a so-called “taper” period that lasts for about 2 weeks. During that time, your fitness will also decrease. But your “battery” level will go up. This aims to build up your energy and allow you to perform at your best on race day.
Where do we get the data from?
To calculate fitness, we use the workout data provided by you in any of 3 ways:
- Training data downloaded from your sports watch.
- Training data you recorded with a built-in GPS tracker.
- Training data that is entered manually.
This all is taken into account. All the data can be easily adjusted, edited, deleted, moved (to another day) or linked to another training session. Use the “Edit” functions within each training or “Add manual entry” to do so.
Important.
If you connect sports devices or your Strava account we have enough data to start calculating Fitness metrics immediately. So you can see the graph just after the registration. For those who start training from scratch, do not connect sports watches or use manual entry it will take some time (approx. 20-30 days) before we accumulate enough data and the graph starts to appear.
As for Training effect metric we always need 20-30 training days with us before the first figure appears. Please note that several first Training Effect figures are quite elevated due to low base. Stay patient, it will finally normalize in 10 days.
Still, have questions? Ask us in chat.
OMY! Sports, your personal AI coach.
